Rian Insights
Helping operations teams eliminate manual reporting and get real-time visibility into their business.
For operations teams spending hours on reports that should build themselves.
How We Work
Every engagement is fixed-scope and priced upfront — no open-ended retainers, no surprise invoices.
Starter Sprint: $2,500 — Single data source, one automated dashboard or report
Core Sprint: $4,500 — 2–3 connected systems, automated pipeline and dashboard
Advanced Sprint: $7,500 — 4+ systems, complex data modeling, AI-enhanced reporting
Services
Reporting automation and operational analytics for teams running on disconnected systems and manual workflows.Analytics & Dashboards — A single, real-time view of what's actually happening in your operation, designed so operations and leadership each see the number that matters to them at a glance. (Power BI, Tableau, QuickSuite)Data Integration & Pipelines — Connecting the systems that don't talk to each other — ERP, CRM, spreadsheets, issue trackers, and operational records — into one reliable source of truth. (Automated with SQL & Python on AWS)Performance Insights — Catching inefficiencies before they become costly: identifying patterns in your operational data, flagging anomalies, and surfacing trends so your team can act early instead of react late.Retainers & Fractional Data Leadership — Ongoing support for teams without a dedicated data function: continuous monitoring, regular reporting, and a roadmap that keeps your data working as your operation grows.
From Blind Spots to Real-Time Visibility
What unified operational data looks like — and how I approach building it
Unifying production data for real-time visibility. A sample project showing how I connect machine, issue, and maintenance data — three systems that usually don't talk — into one live dashboard. Built on a simulated 15-machine operation, it demonstrates the approach I bring to operations running on manual, disconnected reporting.
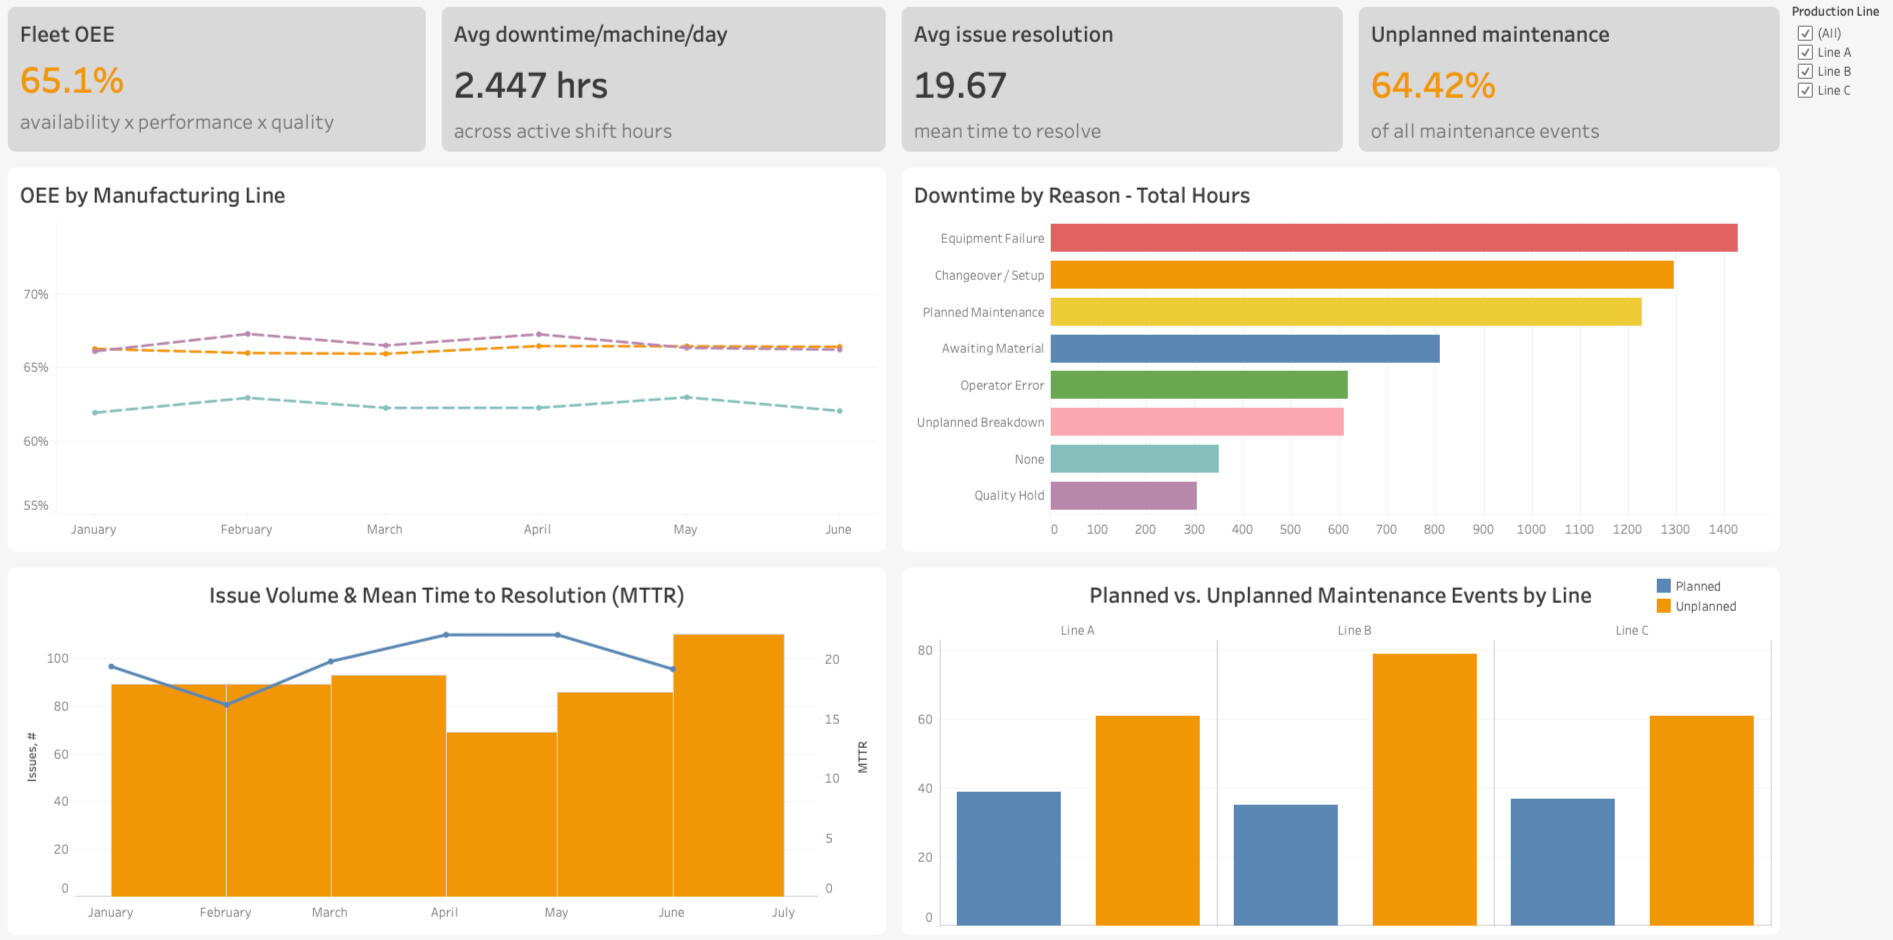
64%
Maintenance that's unplannedReactive fire-fighting, made visible for the first time
3 systems → 1 view
Machine, issue & maintenance data unifiedNo rip-and-replace, no new infrastructure
Days -> real-time
Manual reporting replaced by a live dashboardFrom "how did last week go?" to "why is this happening now?"
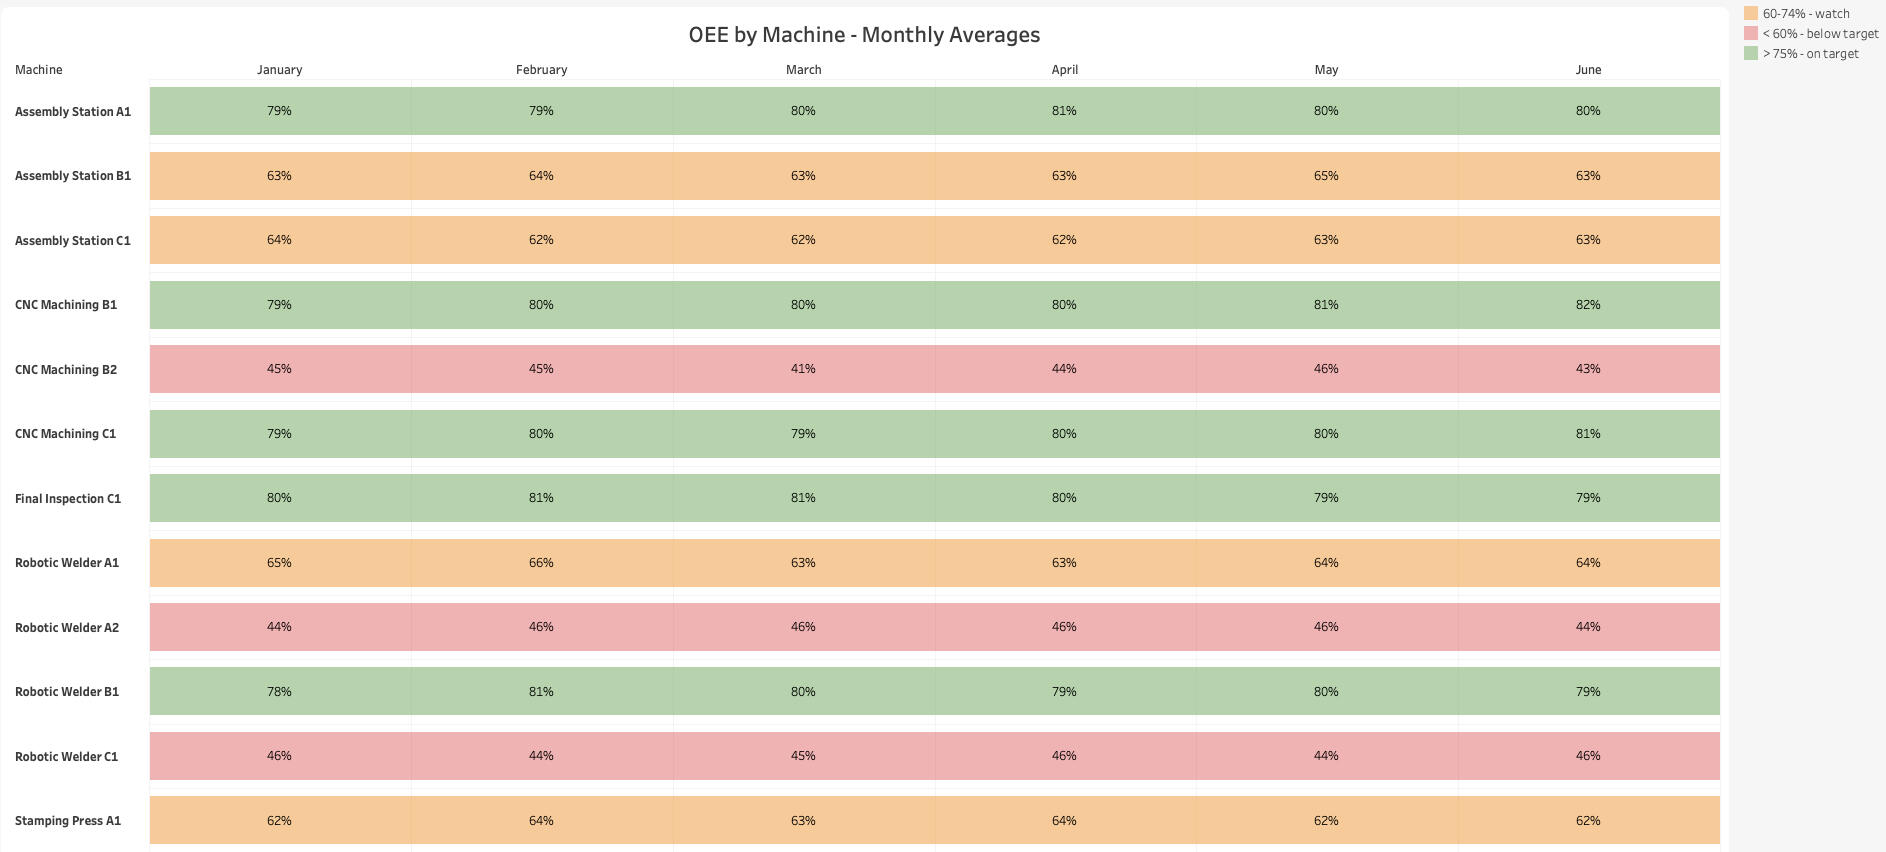
65%
Fleet-wide OEE, with machines ranging 44-84%The connected heatmap exposes which lines drag output
The problem this solves
Most operations teams don't have a data problem They have a disconnection problem.The machines know when they're down. The maintenance team knows what they fixed. The operators know which issues keep coming back. But none of those systems talk to each other — so the people who need the full picture never get it.Picture a typical setup: a discrete manufacturer running 15 machines across three production lines, assembling its weekly production report by hand. Someone exports machine logs into one spreadsheet. Someone else pulls the issue tracker into another. Maintenance records live in a third. By the time the numbers are stitched together, they're days old and already incomplete — and nobody fully trusts them.The result is a team running on instinct. Leadership can feel that some machines are dragging down output, but can't prove which ones, why, or what it's costing them.
What's actually going wrong
The ask is usually deceptively simple: give us one place to see what's actually happening in their operation.Underneath that sit three real problems:- Three disconnected sources. Machine sensor data, issue tickets, and maintenance records share no common key, no common time frame, and no single owner.
- No real-time view. Reporting is a manual, backward-looking ritual — not a live operational tool.
- Hidden cost. Without connected data, the most expensive pattern on the floor stays completely invisible: maintenance that's overwhelmingly reactive, not planned.
How I approach it
The answer here isn't a platform migration or a six-month data warehouse project. A operation like this doesn't need more infrastructure — it needs its existing data connected and visible.I build a lightweight unified data layer that does three things:1. Establish a shared key. Every record — a sensor reading, an issue ticket, a work order — ties back to a single machine identity. That one decision makes everything else possible.
2. Align everything to a common timeline. Daily machine metrics, issue timestamps, and maintenance events are normalized so they can be compared, trended, and correlated.
3. Surface it in a single live dashboard. OEE, downtime, issue resolution, and maintenance — the whole operational picture on one screen, filterable by line and refreshed continuously.The emphasis throughout is clarity for decision-makers, not just analysts. A plant manager, an operations VP, and an IT lead can each open the same dashboard and immediately find the number that matters to them.
What the connected view reveals
This is the part that matters. The moment the three sources are joined, patterns that were invisible for months become obvious in seconds. Working through the sample dataset, the unified dashboard surfaces exactly this kind of insight:- Fleet-wide OEE lands at 63% — but that average hides enormous variation. The strongest machines run above 80%; the weakest hover in the mid-40s. The connected heatmap makes the underperformers impossible to miss.
- 64% of all maintenance is unplanned. This is the headline pattern. A plant in this state isn't maintaining its machines — it's reacting to them breaking. That single ratio reframes the entire maintenance conversation.
- Equipment failure and unplanned breakdowns are the two largest sources of lost time, together accounting for the majority of downtime hours — and both concentrate on a handful of identifiable machines.
- Issue resolution time climbs with severity, from a few hours for minor issues to over two days for critical ones — quantifying what unresolved problems actually cost in machine time.None of these are new facts. They're facts the team has always known but never been able to see together.
The shift it creates
The deliverable is a single real-time dashboard that replaces a multi-day manual reporting process — and, more importantly, changes the questions leadership can ask.Instead of "how did last week go?" the conversation becomes "why is Line B running 13 points below Line C, and which three machines are responsible?" That's the shift from reporting to operating.And it's deliberately lightweight: it sits on top of the data sources already in place, requires no rip-and-replace, and is built to be handed off and maintained by the team itself.
Why this matters for your operation
If your reporting is manual, backward-looking, or assembled from systems that don't talk to each other, you're almost certainly carrying a hidden cost you can't yet see — the way a plant like this can't see that nearly two-thirds of its maintenance is reactive.My work is connecting the data you already have into a picture you can actually act on, and translating it into terms that operations, leadership, and IT can all use to make the same decision with confidence.Let's find out what your data has been trying to tell you.